How to use Python as an astronomer
Useful Resources
MIT课程:计算机科学“补漏”课
Python for Astronomers
Data Visualization
Book: Fundamentals of Data Visualization
Really really nice book on principles of plotting and visualizing data. Like it! I will post some content below later.
Other packages for plot
- mpld3: renderer interactive figures (using d3) for Matplotlib code. Quite nice, though incomplete. Worth trying!
- Altair is a relatively new declarative visualization library for Python. It’s easy to use and makes great looking plots, however the ability to customize those plots is not nearly as powerful as in Matplotlib.
- plot.ly can generate nice plots - this used to be a paid service only but was recently open sourced. Looks fancy!
- ipympl introduces interactive widgets of matplotlib in Jupyter notebook and JupyterLab.
Incredible cheat sheet for Matplotlib!
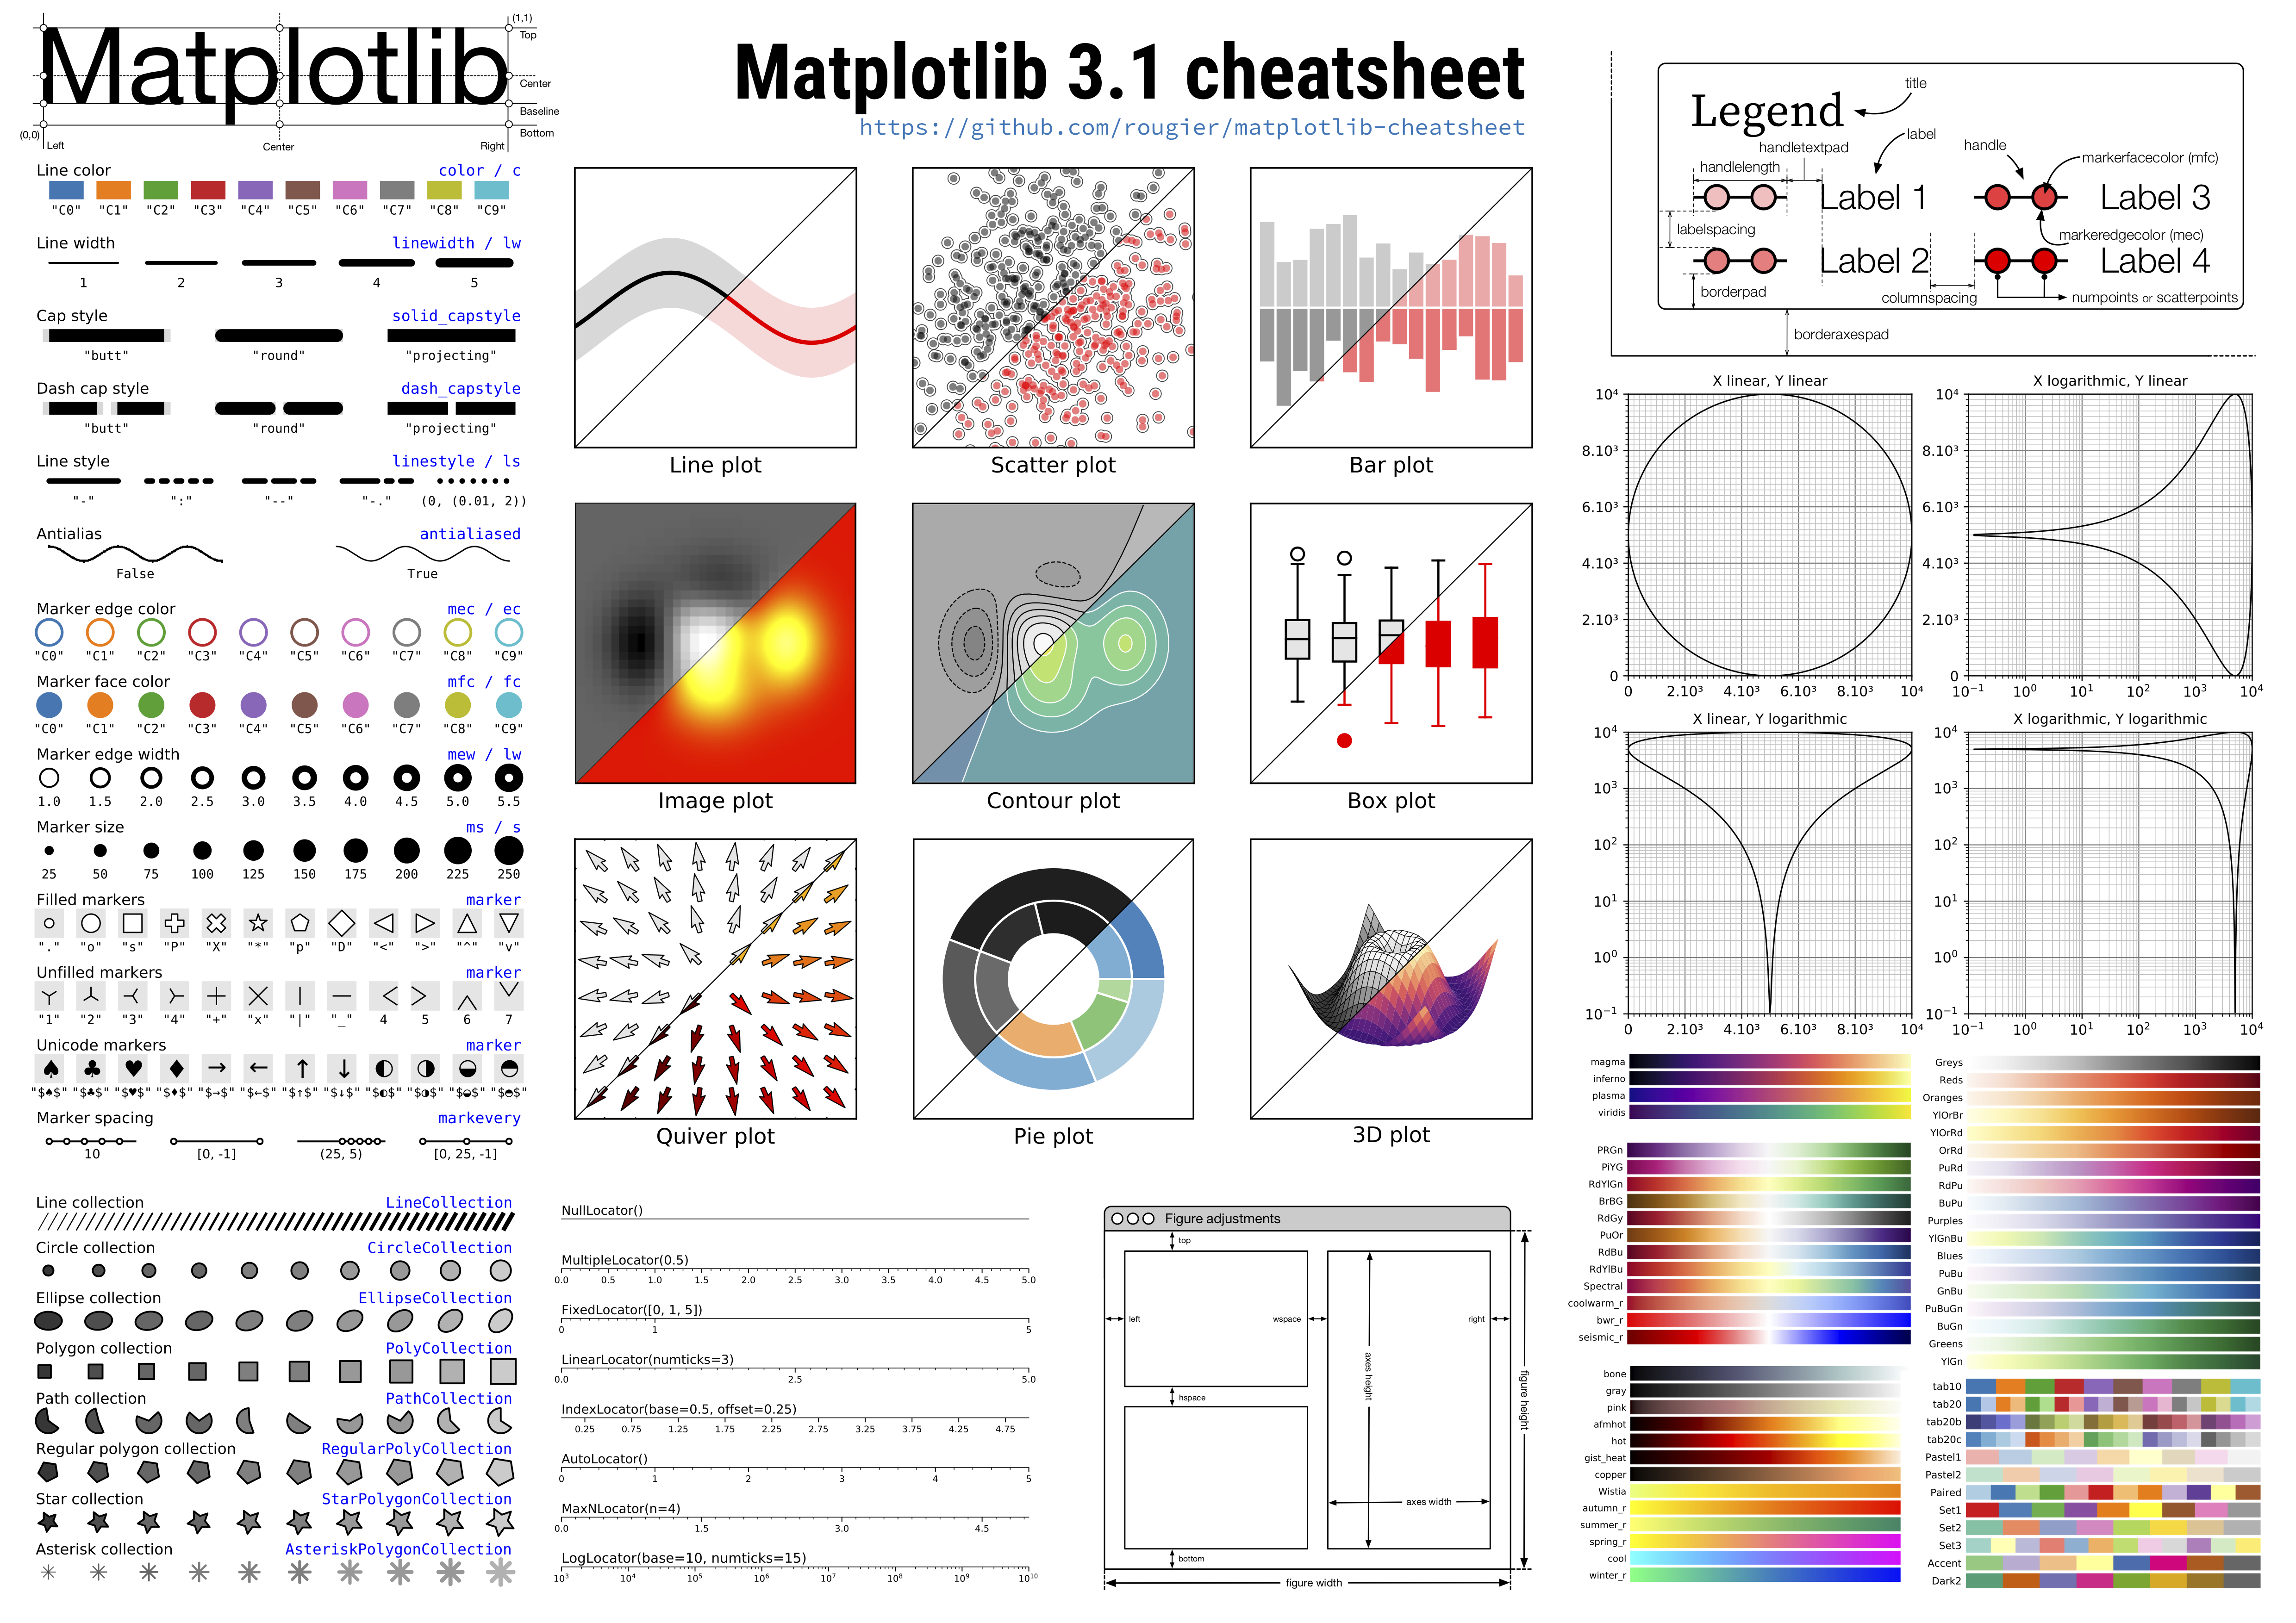
- `Matplotlib` cheatsheet
And here are some commands in common use.
%matplotlib inline
%load_ext autoreload
%autoreload 2
from IPython.display import clear_output

plt.rcParams['figure.dpi'] = 200.0
plt.rcParams['figure.facecolor'] = 'w'
plt.rcParams['font.family'] = 'serif'
plt.rcParams['font.size'] = 25.0
plt.rcParams['text.usetex'] = True

fig, ax = plt.subplots(1, 2, figsize=(10, 10)) # Two columns
ax.tick_params(direction='in')         # Set tick direction to 'in'
ax2.get_shared_y_axes().join(ax1, ax2) # Share axis
ax.axis('off') # No frame when showing images
plt.savefig('xxx.png', dpi=200, bbox_inches='tight') # Save without empty margin
# If you find your figure too large, pass `rasterized=True` to `plt.savefig()`.
How to create a zoom-in inset in a figure?
Useful Python packages in astrophysics:
Here I only list several nice packages in astrophysics research. For more please check my GitHub stars and GitHub astrophysics and astronomy topics.
taotie: A curated collection of resources for astrophysical research, best tutorial for anyone in this field!unagi: Search and download data from Hyper Suprime-Cam (HSC) Subaru Strategic Survey (SSP). Useful for people working with HSC data.photutils: Astropy package for source detection and photometry, basically substitutes of many IRAF functions.galsim: Galaxy image simulation tool, broadly used in weak lensing and mock tests in galaxy research.prospector: Python code for Stellar Population Inference from Spectra and SEDs.-
sedpy: Utilities for astronomical spectral energy distributions. healpy: It is a package dealing with data on a sphere. It can map every direction to a pixel position, and vice versa. It can also calculate power spectrum of things like CMB. Although it’s super useful, its python documentation is really unfriendly for beginners.starry: very cool package that can calculate light curves of transits and secondary eclipses of exoplanets, light curves of eclipsing binaries, rotational phase curves of exoplanets, light curves of planet-planet and planet-moon occultations, and more. A very cool tutorial: A map of the hot jupiter HD 189733b.cosmology: cosmology package based on C, written by esheldon. Fast calculate distances. It can also be replaced byastropy.cosmology.-
corner: A package of drawing corner diagrams of MCMC and 2d histogram. It’s very easy to use and has many options. Good tool! You can find some examples in theSN cosmology.ipynb. Song Huang also usescornerto “explore” data: plot everything with everything. It can check the dependence between variables directly. Example by Song Huang:import corner sdss_labels = [ r'$u-g$', r'$g-i$', r'$\log \mathrm{EW}_{\mathrm{H}\alpha}$', r'$\log \mathrm{EW}_{\mathrm{H}\beta}$', r'$\log \mathrm{EW}_{[\mathrm{OIII}]}$' ] sdss_corner = corner.corner( sdss_obs, bins=15, color=plt.get_cmap('coolwarm')(0.9), smooth=0.5, labels=sdss_labels, label_kwargs={'fontsize': 22}, quantiles=[0.16, 0.5, 0.84], plot_contours=True, fill_contours=True, show_titles=True, title_kwargs={"fontsize": 18}, hist_kwargs={"histtype": 'stepfilled', "alpha": 0.8, "edgecolor": "none"}, use_math_text=True) sdss_corner.set_size_inches(14, 14) -
multiprocess.Pool: simple tool to run your loop tasks on multiple cores. This is embedded inpythonitself, and goes like below. For more complicated usage (multiple arguments as input), please refer to the documentation.from multiprocessing import Pool def run_SBP(obj): slug.run_SBP(obj) print('Number of processor to use:') n_jobs = int(input()) pool = Pool(n_jobs) pool.map(run_SBP, obj_cat) -
joblib: an awesome tool of building pipelines in python. Just like a superiorpickle, it can dump and load functions and data (especially large data arrays) efficiently. It can also distribute loop tasks to multiple processors. See the usages below:# Parallel computing from joblib import Parallel, delayed def run_SBP(obj): slug.run_SBP(obj) n_jobs = 4 with Parallel(n_jobs=n_jobs, backend='loky') as parallel: parallel(delayed(run_SBP)(obj) for obj in obj_cat)There are various backends for this
Parallelfunction, such asloky,threadingand alsomultiprocessingas stated above.# Dump and load from sklearn.neighbors import KNeighborsClassifier knn = KNeighborsClassifier() knn.fit(X_train, y_train) print(metrics.classification_report(y_test, knn.predict(X_test))) # After training a classifier using scikit-learn, # you want to dump it and use it next time. import joblib joblib.dump(knn, './clf_cache/knn.joblib') # If you want to dump the file after compressing, use this. joblib.dump(knn, './clf_cache/knn.joblib.compress', compress=True) ipyparallel: Using IPython for parallel computing
Tricks
Useful packages
fire: Python Fire is a library for automatically generating command line interfaces (CLIs) from absolutely any Python object.celluloid: Easy Matplotlib Animation
Build your package
- How to write
requirements.txtfor a package - How to write documentation using
sphinxand publish usingReadthedocs. - Python Packaging User Guider (PyPI): note that when pushing your local files in
distto PyPI, you only need to dopython3 -m twine upload dist/*. Don’t forget to add non-Python files inMANIFEST.inandsetup.py.
Jupyter Notebook & Jupyter Lab
No matter under macOs or Linux, or even under Windows, you’ll find that a quick check of Jupiter Notebook is hard and cumbersome. You need to open jupyter notebook in this folder to check, then terminate this thread. However, using a new tool ipynb-quicklook and a new app Jupyter Notebook Viewer, things get much more easier (under macOS and linux). Simply press space and check your notebooks!
The following are some other tricks involved when using jupyter notebook.
Command + click: multiple cursors in a cell.%load_ext autoreload: import the IPython extension calledautoreload. Then%autoreload 2will reload every module again automatically before executing.%%time: Magic command to time your cell for a single run. Useful!%%timeit: this command can be used to test your code’s performance. It runs your cell for many times and calculate the mean time consumed.%matplotlib inline: show Matplotlib figures inline. Useful!%matplotlib qt: show Matplotlib figures outside in aQtinterface, in which you can check positions and corresponding value of points.%run ./two-histograms.ipynb: this will run the notebook directly and shows every output from that notebook under this cell.%load ./download_tri_color_images.py: load the functions and constants defined in the input python file, and run this file.%config InlineBackend.figure_format ='retina': show high resolution figures for Mac Retina screen. This won’t affect the figure which is saved, it only affect the figure which is showed usingplt.show()._means the previous output. By adding;in the end of a command, it will suppress the useless output of a function.- Basic shell commands:
!is external shell command, and&is to run this command as background.
- Basic shell commands:
- Click +
control: Jupyter supports multiple cursors, similar to Sublime Text. (Usealton Windows) %debugmagic command: when you encounter an error, type this magic command in a new cell and run it. Typento run the next line of code, typecto continue until the next breakpoint, and typeqto quit. This magic command can also be used to check the value of variables, just type the name of the variable.from IPython.core.debugger import set_trace: useset_trace()to set a breakpoint in your cell or code block. The code will stop at the breakpoint and give you the chance to inspect variables.- Jupyter extensions: my favorite extensions are Codefolding, Nofity and Code prettify. You can simply install it by
pip install jupyter_contrib_nbextensionsorconda install -c conda-forge jupyter_contrib_nbextensions. - Recently I switched to
jupyter lab! It is faster thanjupyter notebook.
Formatting strings
Tutorial: https://pyformat.info. I often use length = {:.2f}.format(3.1415) or name = "DECaLS_{}".format('g_band'}.
In Python 3.6, f-string can be used: flength = {len(obj_cat):3d}.
RegEx: Regular Expression
Tutorial: https://github.com/ziishaned/learn-regex.
Using Tqdm to show progress
See https://github.com/tqdm/tqdm/wiki/How-to-make-a-great-Progress-Bar.
from slug.imutils import TqdmUpTo
url = imutils.gen_url_hsc_s18a(obj['RA'], obj['Dec'],
                       size * slug.HSC_pixel_scale,
                       size * slug.HSC_pixel_scale, band)[0]
#urllib.request.urlretrieve(url, filename, imutils.reporthook)
with TqdmUpTo(unit='B', unit_scale=True, miniters=1, desc=prefix) as t:  # all optional kwargs
    urllib.request.urlretrieve(url, filename=filename,
                       reporthook=t.update_to, data=None)
Unix
Rsync
We use rsync to transfer files between two computers. It often goes like:
rsync -avz --progress jiaxuanli@kungpao.ucsc.edu:/Users/jiaxuanli/Document/xxx.fits ~/Research/
SSH
SSH is a tunnel through which you can connect with another computer (with fixed IP). It often goes like:
Login kungpao: ssh -A -Y jiaxuanli@kungpao.ucsc.edu. However you can set alias for this command by write alias login_kungpao='ssh -A -Y jiaxuanli@kungpao.ucsc.edu' in your .bash_profile.
Using the internet of kungpao: ssh -g -qfnNT -D 7070 jiaxuanli@kungpao.ucsc.edu and then set the port of SOCKS to be 7070.
Using Jupiter Notebook on kungpao but control it locally: ssh -Y -N -L localhost:9999:localhost:9999 jiaxuanli@kungpao.ucsc.edu (on your laptop); jupyter notebook --no-browser --port=9999 (on your server kungpao).
The SSH session may be timeout very soon, check here for solutions.
SSHFS
When you find that using ssh and rsync is not convenient to see what you did, you need sshfs to mount your remote server to the local directory.
First, you need to download and install OSXFUSE and SSHFS on https://osxfuse.github.io (directly download the .pkg files under “Stable Releases” and then install them.) Then, you need to set a mounting folder (need to be empty). For example, mkdir ~/Research/kungpao.
Finally, it goes like sshfs jiaxuanli@kungpao.ucsc.edu:/Users/jiaxuanli/ /Users/jiaxuanli/Research/kungpao/ -ovolname=kungpao.
You will see a disk icon in folder ~/Research. To unmount this “disk”, type diskutil unmount ~/Research/kungpao/.
Screen
screen enables me to use multiple windows in the background when using ssh.
Make a new screen window using screen -S Jiaxuan; then do whatever you want in that terminal; and detach that window using Ctrl-a + d. After got detached, the screen terminal is still running in the background. You can reconnect that terminal with screen -r Jiaxuan.